Spara 131 kr
Spara 131 kr
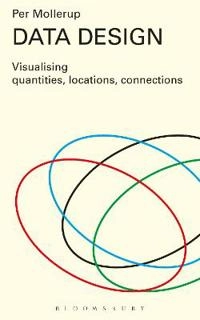
Data design : visualising quantities, locations, connections
- Utgiven: 2015
- ISBN: 9781408191873
- Sidor: 176 st
- Förlag: Bloomsbury Visual Arts
- Format: Häftad
- Språk: Engelska
Om boken
Data Design: Visualising quantities, locations, connections is a lively and comprehensive introduction to data visualisation, illustrated with 199 instructive data displays. The book is for designers, journalists, editors, writers and anyone concerned with presenting factual information in a clear and effective way.
Data Design highlights the key qualities of good data visualisation: accuracy, simplicity, and clarity. In this spirit, Per Mollerup discusses information design with great clarity. The proposed data displays are as simple as possible, and every graphic element is there to convey meaning. This book is not about data decoration.
Data Design can be read from cover to cover, but it doesn’t have to be. It can also serve as a reference guide. Each of the data displays included is explained in such a way as to clarify the problems to be addressed and the method by which to address them, enabling the reader to develop the skills with which to improve their data visualisation designs.
Åtkomstkoder och digitalt tilläggsmaterial garanteras inte med begagnade böcker
Mer om Data design : visualising quantities, locations, connections (2015)
2015 släpptes boken Data design : visualising quantities, locations, connections skriven av Per Mollerup. Den är skriven på engelska och består av 176 sidor. Förlaget bakom boken är Bloomsbury Visual Arts.
Köp boken Data design : visualising quantities, locations, connections på Studentapan och spara uppåt 27% jämfört med lägsta nypris hos bokhandeln.
Referera till Data design : visualising quantities, locations, connections
Harvard
Mollerup, P. (2015). Data design : visualising quantities, locations, connections. Bloomsbury Visual Arts.
Oxford
Mollerup, Per, Data design : visualising quantities, locations, connections (Bloomsbury Visual Arts, 2015).
APA
Mollerup, P. (2015). Data design : visualising quantities, locations, connections. Bloomsbury Visual Arts.
Vancouver
Mollerup P. Data design : visualising quantities, locations, connections. Bloomsbury Visual Arts; 2015.
citeproc-js implements the Citation Style Language. (c) Frank Bennett. Licenser och källkod.