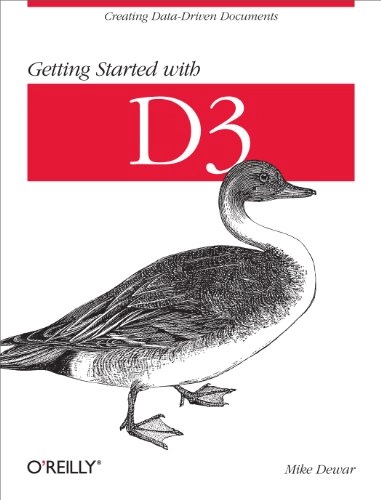
Getting Started with D3 Upplaga 1
- Upplaga: 1a upplagan
- Utgiven: 2012
- ISBN: 9781449328795
- Sidor: 50 st
- Förlag: O'Reilly Media
- Format: Häftad
- Språk: Engelska
Om boken
Learn how to create beautiful, interactive, browser-based data visualizations with the D3 JavaScript library. This hands-on book shows you how to use a combination of JavaScript and SVG to build everything from simple bar charts to complex infographics. You'll learn how to use basic D3 tools by building visualizations based on real data from the New York Metropolitan Transit Authority.Using historical tables, geographical information, and other data, you'll graph bus breakdowns and accidents and the percentage of subway trains running on time, among other examples. By the end of the book, you'll be prepared to build your own web-based data visualizations with D3.Join a dataset with elements of a webpage, and modify the elements based on the data Map data values onto pixels and colors with D3's scale objects Apply axis and line generators to simplify aspects of building visualizations Create a simple UI that allows users to investigate and compare data Use D3 transitions in your UI to animate important aspects of the data Get an introduction to D3 layout tools for building more sophisticated visualizations If you can code and manipulate data, and know how to work with JavaScript and SVG, this book is for you.
Åtkomstkoder och digitalt tilläggsmaterial garanteras inte med begagnade böcker
Mer om Getting Started with D3 (2012)
I augusti 2012 släpptes boken Getting Started with D3 skriven av Mike Dewar. Det är den 1a upplagan av kursboken. Den är skriven på engelska och består av 50 sidor. Förlaget bakom boken är O'Reilly Media.
Köp boken Getting Started with D3 på Studentapan och spara pengar.
Referera till Getting Started with D3 (Upplaga 1)
Harvard
Dewar, M. (2012). Getting Started with D3. 1:a uppl. O’Reilly Media.
Oxford
Dewar, Mike, Getting Started with D3, 1 uppl. (O’Reilly Media, 2012).
APA
Dewar, M. (2012). Getting Started with D3 (1:a uppl.). O’Reilly Media.
Vancouver
Dewar M. Getting Started with D3. 1:a uppl. O’Reilly Media; 2012.
citeproc-js implements the Citation Style Language. (c) Frank Bennett. Licenser och källkod.