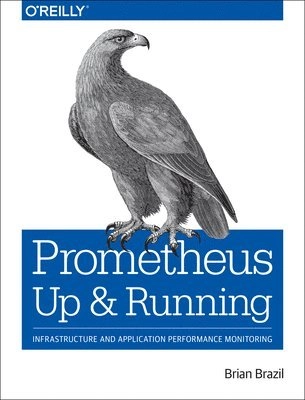
Prometheus - Up & Running
- Utgiven: 2018
- ISBN: 9781492034148
- Sidor: 350 st
- Förlag: O'Reilly Media
- Format: Häftad
- Språk: Engelska
Om boken
Get up to speed with Prometheus, the metrics-based monitoring system used by thousands of organizations in production. This practical guide provides application developers, sysadmins, and DevOps practitioners with a hands-on introduction to the important aspects of Prometheus, including infrastructure and application monitoring, dashboarding and alerting, direct code instrumentation, and metric collection from third-party systems with exporters. This open source system has gained popularity over the past few years for good reason. With its simple yet powerful data model and query language, Prometheus does one thing and it does it well. Author and Prometheus core developer Brian Brazil guides you through Prometheus setup, the Node Exporter, and the Alertmanager, then guides you through its use in application and infrastructure monitoring. Know where and how much to apply instrumentation to your application code Expose metrics through client libraries to make them available to Prometheus Identify metrics with labels: unique key-value pairs associated with a time series Get an introduction to Grafana, a popular tool for building dashboards Learn how to use the node exporter to monitor your infrastructure Use service discovery to provide different views of your machines and services Use Prometheus with Kubernetes, and examine exporters you can use with containers Convert data from other monitoring systems into the Prometheus format
Åtkomstkoder och digitalt tilläggsmaterial garanteras inte med begagnade böcker
Mer om Prometheus - Up & Running (2018)
I juli 2018 släpptes boken Prometheus - Up & Running skriven av Brian Brazil. Den är skriven på engelska och består av 350 sidor. Förlaget bakom boken är O'Reilly Media.
Köp boken Prometheus - Up & Running på Studentapan och spara pengar.
Referera till Prometheus - Up & Running
Harvard
Brazil, B. (2018). Prometheus - Up & Running. O’Reilly Media.
Oxford
Brazil, Brian, Prometheus - Up & Running (O’Reilly Media, 2018).
APA
Brazil, B. (2018). Prometheus - Up & Running. O’Reilly Media.
Vancouver
Brazil B. Prometheus - Up & Running. O’Reilly Media; 2018.
citeproc-js implements the Citation Style Language. (c) Frank Bennett. Licenser och källkod.
Köp boken
Bara 1 säljare kvar!
429 kr
GRATIS frakt & skickas senast på tisdag, 10 november.
Beställ inom 0 tim 23 min

Utmärkt skick
Olle